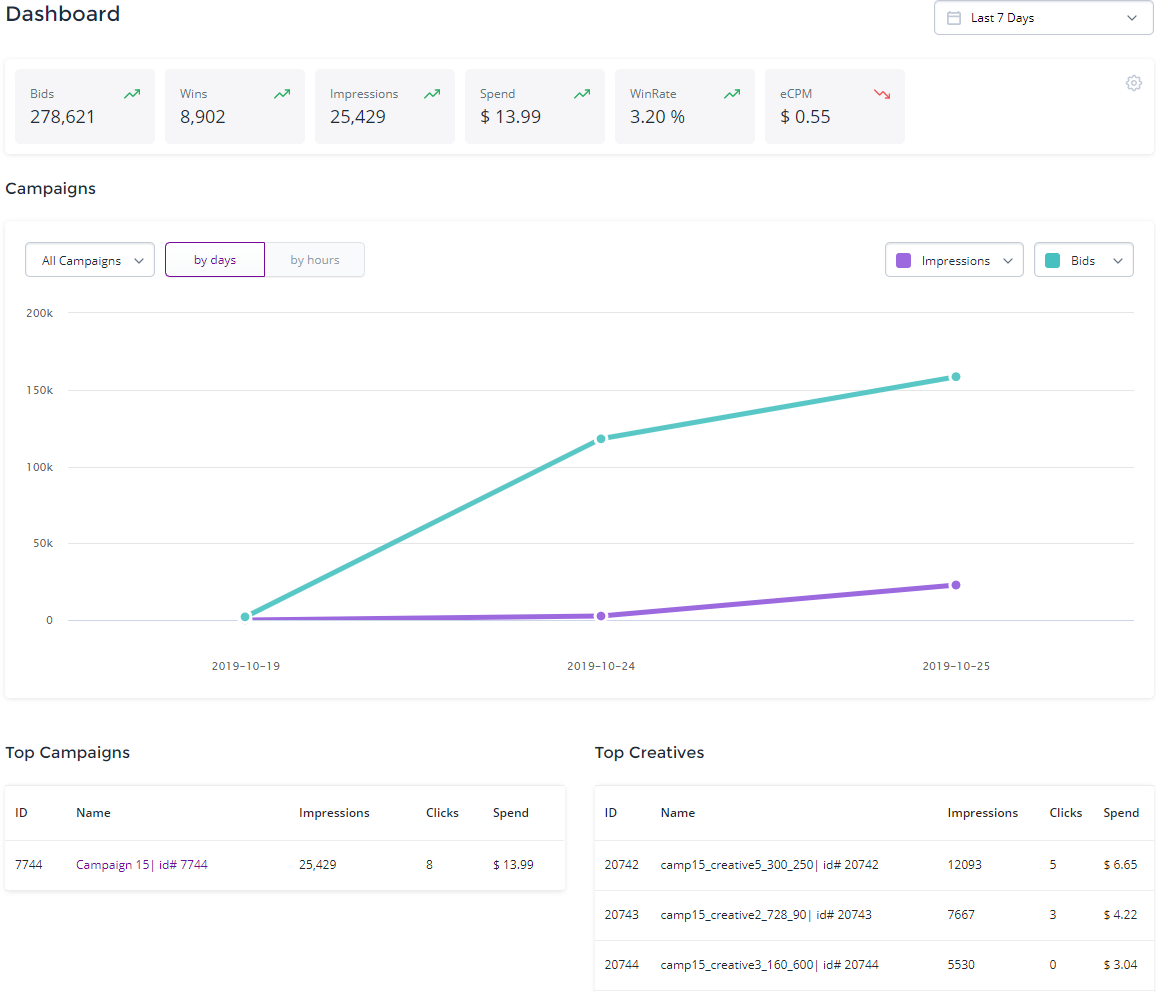
Dashboard
This section shows you brief information on the effectiveness of your
campaigns and creatives, as well as your main metrics.
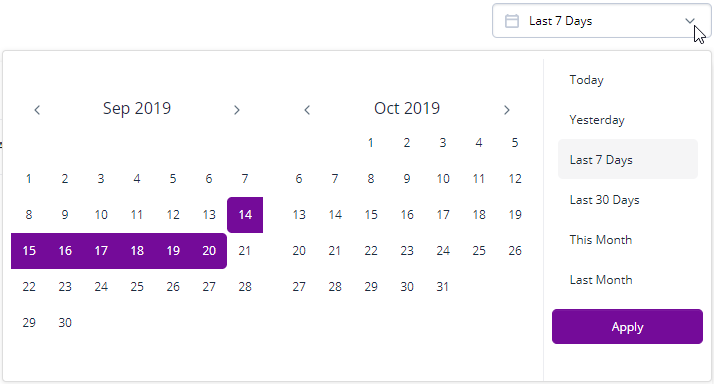
First of all, set the date range in the upper right corner. Click on the
date range, then click on the first date and the last date, and click
[Apply]. Alternatively, you can click on the predefined time period on the right and then click on it to select it
[Apply]:
Information on the page will be updated instantly.
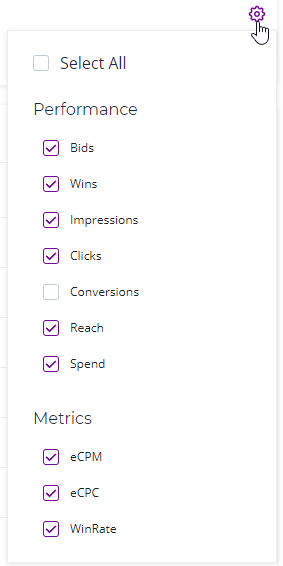
At the top of the page, you will see gauges displaying metrics such as Impressions, Win Rate, Spend, and more. Click the 'gear' button at the right to select gauges to display:
See the 'Campaigns' section for more information about metrics.
In the main area of the page, you will find a graph displaying the dynamics of two selected metrics.
Above the graph, there are the following controls:
- campaigns selector which allows choosing a particular campaign or all campaigns
- 'by days/by hours' switcher – you can choose whether to group data by hours or by days.
- entities selector — you can choose two entities to display (one in green, another in purple color), for example, impressions and wins. Immediately after changing the entity, you will see the graph displaying its dynamics.