Getting started
Welcome to the all-new, fast, and flexible SmartyAds demand-side platform!
SmartyAds DSP is a comprehensive demand-side platform designed to empower advertisers, agencies, and media buyers with a versatile multi-channel programmatic suite. Our platform enables you to run effective ad campaigns that seamlessly convert your target audience into customers in real time.
This user guide will assist you in getting started with promoting and advertising your brands and products successfully.
Glossary
Here is a brief glossary to introduce the basic concepts used in the system:
Creative: The advertising item that is displayed to the user. Typically, it consists of visual content such as banner images, videos, or text.
Campaign: The primary tool used by advertisers to configure various parameters of their advertising strategy, including time range, targeting options, budgeting, and more.
Targeting: Settings that define the specific characteristics of the audience you want to reach with your advertising. This can include factors such as their devices, approximate location, ad preferences, interests, and more.
Retargeting: A technology that enables you to target users who have previously been targeted by your campaign or have visited your website. It allows for more personalized and tailored advertising.
Audience or Retargeting List: A list of users who have been collected after being targeted by another campaign. Users can be added to audiences based on various actions such as clicks, pixels, or conversions.
Interface
The pages of the system are designed with elements grouped according to their functionality. This organization helps users navigate and access the specific features and tools they need efficiently. By grouping elements based on their purpose and functionality, users can easily locate and utilize the various features and functions offered by the system.
Let's take a glance at these areas:
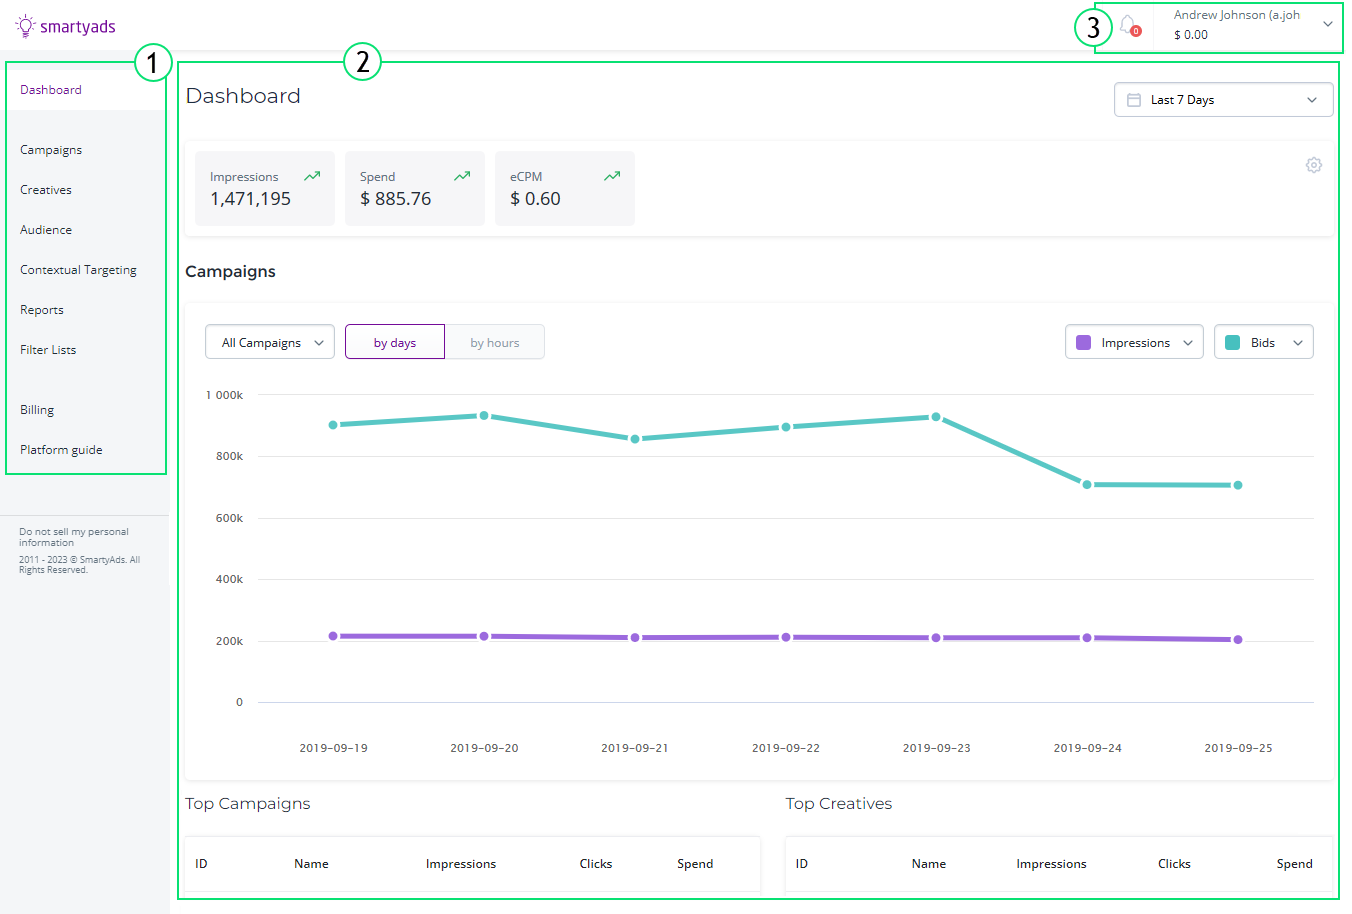
1.Sections. Located on the left, it allows switching between sections to
see the different types of information.
- Dashboard – summary of campaigns and other indicators.
- Campaigns – one of the main entities of the system, that allows you to set a promotion strategy. Simply, a campaign is a system of settings that defines how and whom to display a set of creatives.
- Creatives – items of advertising that are shown to the user.
- Audience – lists of users who were collected after being targeted by the campaign or visiting the advertiser's website. Retargeting campaigns target users collected by audiences.
- Reports – aggregated information by key point indicators, such as bids, impressions, spend, etc.
- Filter Lists – lists that allow filtering by such entities as IP addresses, domains, apps, device identifiers, etc.
- Contextual Targeting – the mechanism for targeting websites according to their categories and keywords in the content.
- Billing, Invoices, Transactions – these sections provide information on payments.
2.Section page. This area displays all information about the selected
section, usually in the form of tables or graphs. Section page may contain
'Add new record' and/or data selection buttons. Section page also
may contain such areas and controls as Dashboard area, Date range
selector, Search, etc.
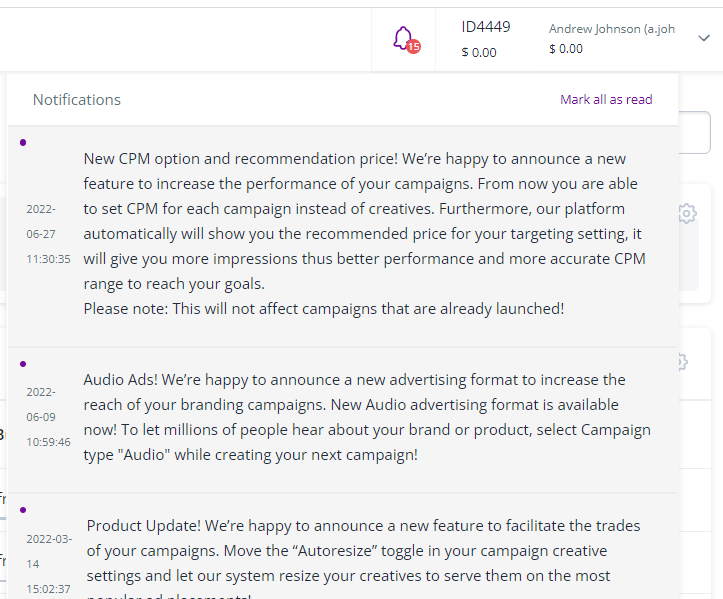
3.Notifications and profile. You can open and edit your profile and see\
all notifications on the events that happened, such as creative approval, etc.