Reports
In this section, you can observe the performance trends of your campaigns over a specific period of time. You will be able to view various metrics such as the number of impressions, conversions, changes in eCPM (effective cost per mille), total spend, and more.
Also, there’s a separate report for Video campaigns. Use the General/Video selector to switch between those reports:

In the Video report, the data is organized and presented in groups based on the Date and Event columns, which represent the dates and specific events that occur within the video ads.
You can group results by days or by hours. Use the switcher in the right upper corner to do so.
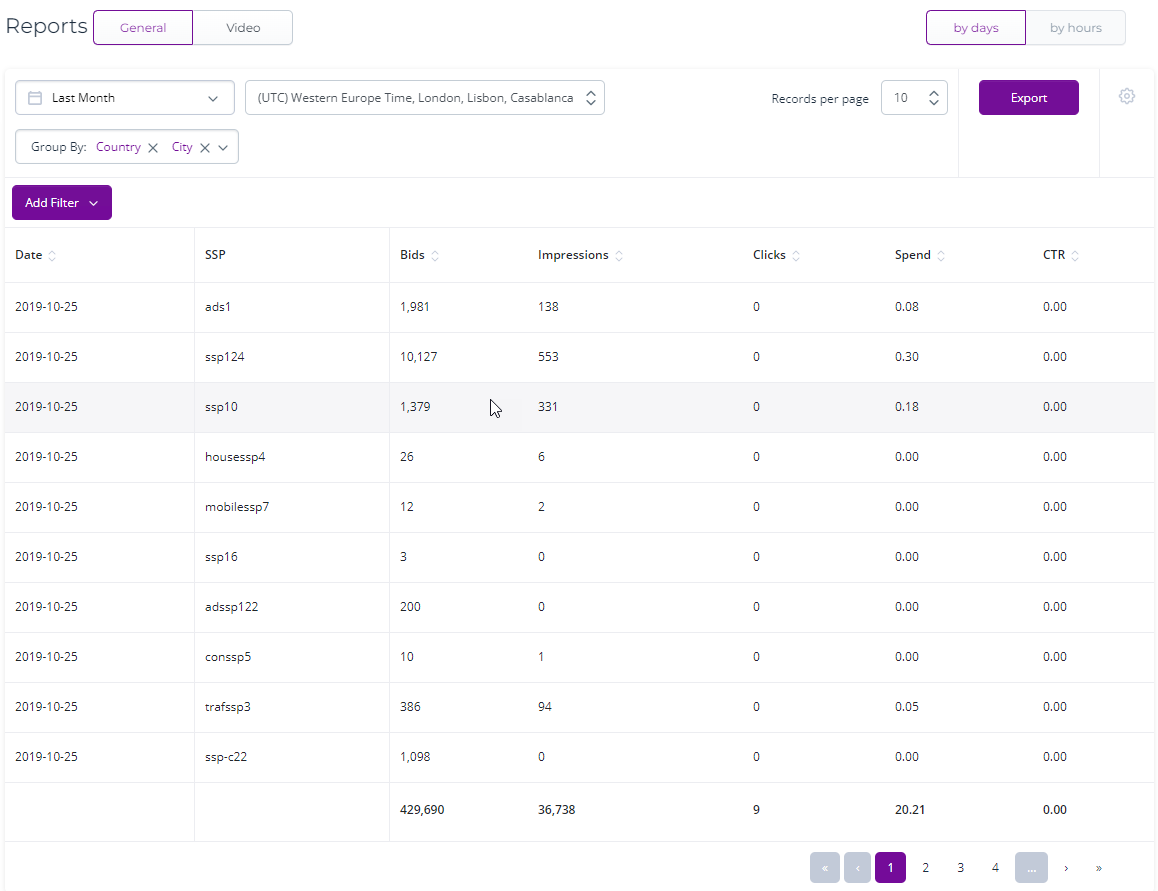
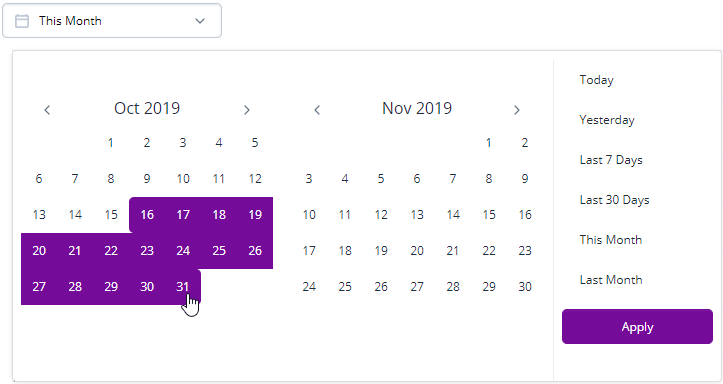
At the top of the table, you have the ability to select the desired date range and choose the fields by which you want to group the information.
There are several predefined date ranges available, including options such as Today, Yesterday, Last 7 Days, Last 30 Days, This Month, and Last Month. Additionally, you can set a custom date range by clicking on the starting date and then selecting the ending date.
Then, after the date range is selected, click 'Apply':
In the upper right corner, you can set the number of records to display on page (10, 20, 50, 100), download the data by clicking 'Export', and select columns to display:
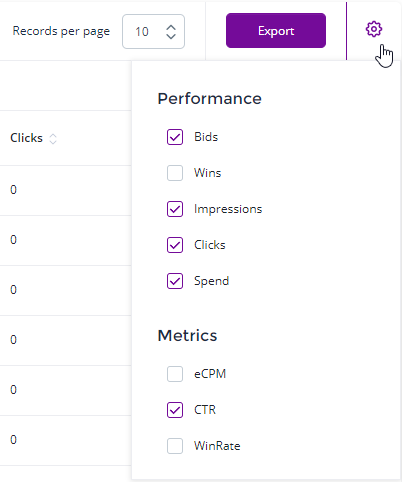
There are two 'groups' of columns you can select: performance and metrics.
Performance:
-
Bids – the number of bids performed by your campaigns. The bid is when a campaign participates in an auction (each time when the user opens the ad placement) in order to be able to display the creative.
-
Wins – the number of auctions wins by campaigns.
-
Impressions – the number means how many times your ads have been shown to users.
-
Clicks – the number of clicks on your ads made by users.
-
Spend – the sum you have spent, $.
Metrics:
-
eCPM – effective CPM. It is the resulting price obtained as a result of calculation by the formula ‘resulting price * 1000 / number of impressions’
-
CTR – click-through-rate, the clicks-to-impressions ratio.
-
WinRate – wins to bids ratio. In a general sense, it shows how competitive was the campaign among the rest of the advertisers who competed for the placements.
Below the table view, there is a graph:
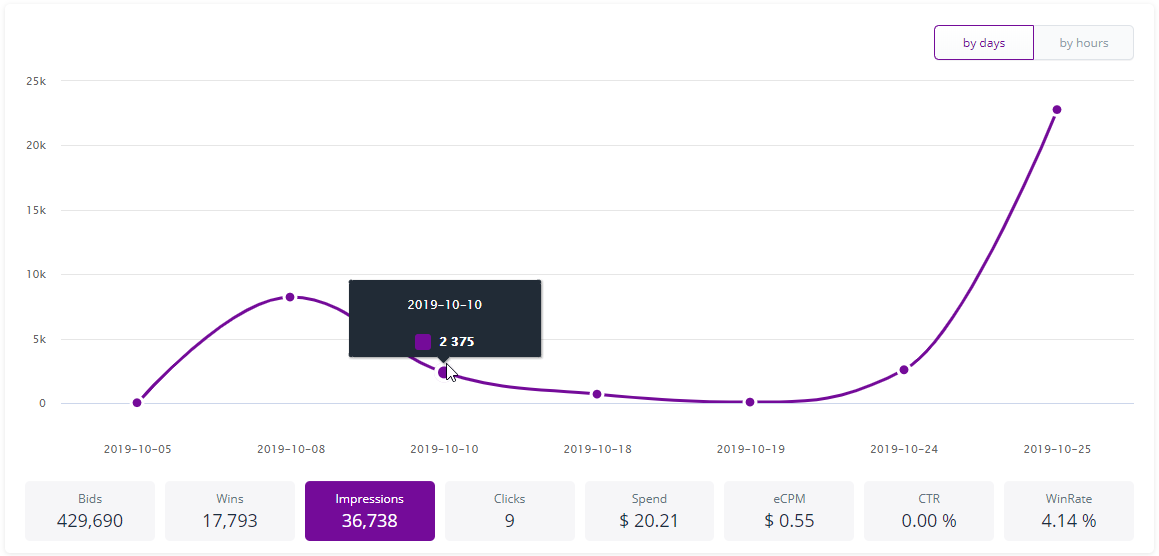
You can select how to group info: by days or by hours.
You can click on blocks below the graph to change the type of info displayed: Bids, Impressions, Spend, etc.
Hover the mouse over the graph line to see detailed info at some point: date and exact number of selected metrics, for example, the number of impressions.